"Everyone has a plan until they get punched in the mouth." - Mike Tyson
What would you do if one or more of the positions fell more than 20% in a short period of time? How would you react? Would you sell immediately for fear that it would continue to fall, or would you increase your position?
Having a methodology to follow in those moments of crisis goes a long way to take advantage of these opportunities and turn them into a win instead of a loss.
In this article, I share some thoughts on how face these market situations and some frameworks that had served me well in the past. Let's get started.
Setting the Table
Before I start writing about "how to react," I have to focus on "how to prepare," and this has to do with correctly tracking the stocks in the portfolio. Following stocks in your portfolio involves a series of tasks related to the fundamental metrics of the business, but for this discussion, I am only going to focus on having a setup that allows me to answer two simple questions (since is a sharp price decline what we are worrying about):
What is my average cost basis?
Was there a significant movement in the stock price?
The truth is, one could track everything in an Excel or Google Sheets and check every day. Or, easier, you can use the Yahoo Finance app to create price drop alerts.
Volatility in the share price will always be there. Typically, drops of more than 5% in a single day, or more than 20% over a period of days, can be due to reasons having to do with changes in the market environment or fundamental changes in the company's capacity to generate profits.
While the volatility of each industry is different, as a quick rule, I set my alerts in the Yahoo Finance app with those limits: a 5% daily decline or a price 20% below the purchase price.
If I receive a notification from the app, I kick start the analysis process that I share with you below.
The first step is to differentiate if it is a general market drop or if it is a drop in the particular stock price for which I received the notification. How do I differentiate between both cases?
Was That a Generalized Market Decline or Just My Position's Own Volatility?
First of all, I look at how the major market indices, such as the S&P 500, Dow Jones, and NASDAQ, are moving. This look gives me a clear idea of the general market trend. Also, let’s not forget about economic and political news. Recent developments, both economic and political, may be playing an important role in global financial markets.
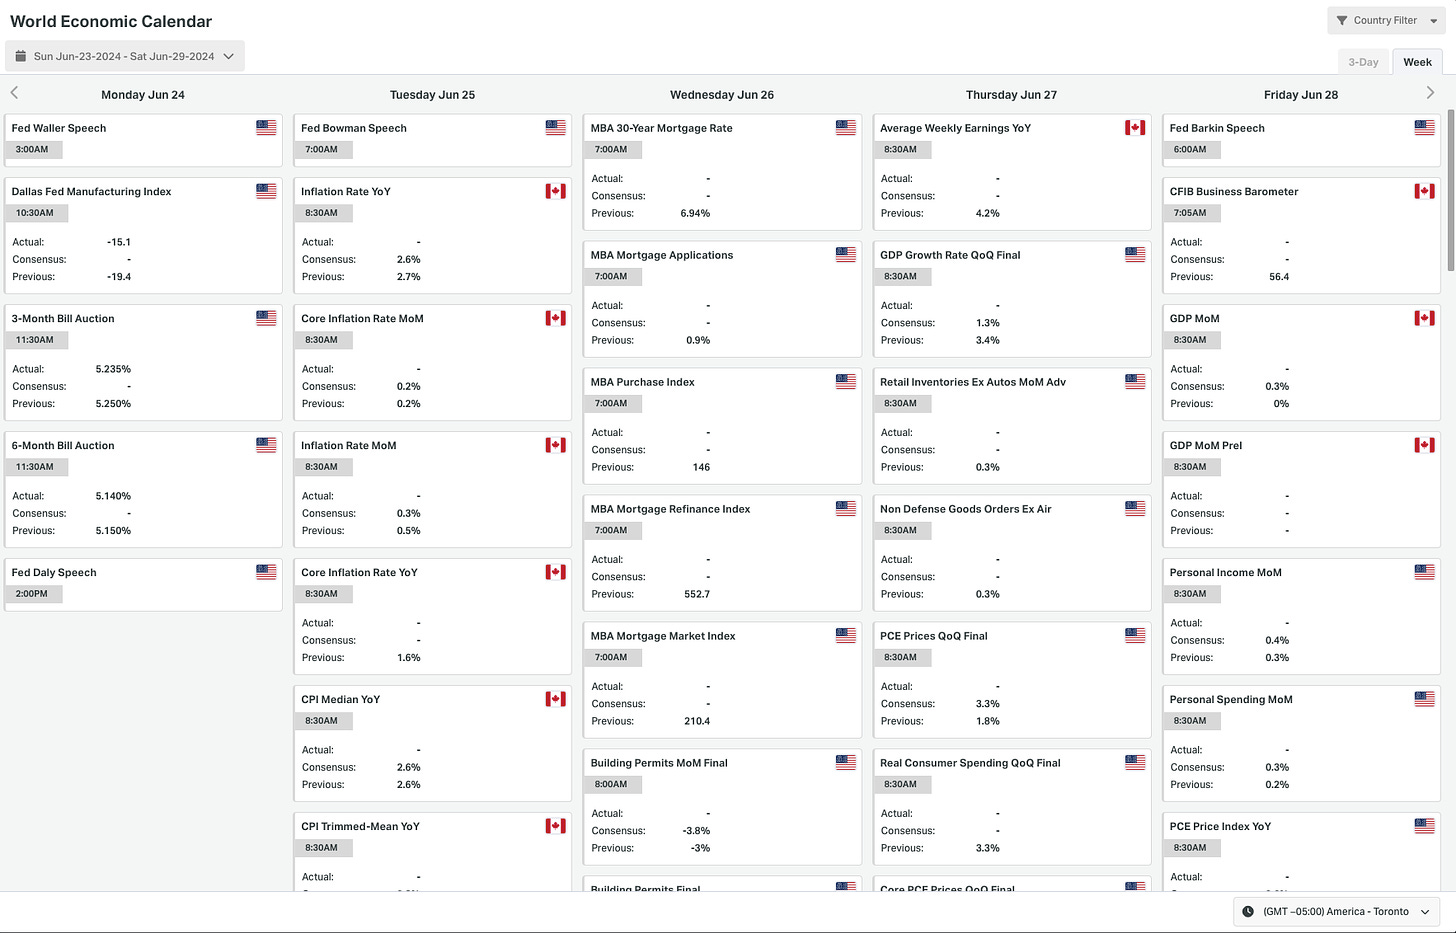
There is a calendar of economic announcements that is worth following since variables such as changes in interest rates and monetary policy, GDP, inflation, and employment have a strong impact on the markets as they move expectations of the general health of the economy.
Once the global analysis of the markets and the economy has been carried out, the sectoral analysis follows. Compare how the stocks in your portfolio are moving against the overall performance of their sector. This will help you understand if what is happening is something specific to your portfolio or if it is a trend in the sector itself.
Also, stay up to date with news and events affecting that particular sector, as they can have a direct impact on the value of your shares.
Finally, after analyzing the economy, the market, and the sector in particular, it is time to review the fundamentals of the company, such as income, profits, and debt. If I see a worsening of these indicators, this could be a sign of specific problems. Furthermore, recent news about the company are usually crucial in sharp price movements. Changes in management, a scandal, or the launch of new products can significantly influence the share price.
In general, those are the steps I take to determine if the abrupt movement in a stock's price is due to the market or issues of the particular company.
Now, let’s continue with how to react to each of those situations.
Reacting to Widespread Market Declines
Generalized market declines are usually great situations to increase weight in positions in the portfolio since, by definition, the price drop was not generated by a problem with the company itself. Instead of panicking, thinking about it as something like a stock market "Black Friday" is a good mental model to have.
If the market goes down more than 20% and even 30%, assuming none of the positions in the portfolio is fundamentally affected by the drawdown, one can sell part of the more stable and blue chip companies whose shares have not fallen much and buy other stocks that, although they are good quality and their business has not been affected, have been excessively punished by the market. I would be basically responding to a change in the distribution of outcomes for each position and rebalancing the portfolio accordingly.
Of course, a careful analysis of each company given the new market environment is required before implementing any type of strategy.
Now, which are some mistakes one can make in these situations? Let’s see.
Three Common Pitfalls to Avoid
Firstly, one of the most common mistakes is not being able to bear the pain and selling when the market has fallen 20%, fearing that it will fall even more.
As we will see later, drops of more than 20% or 30% are extremely rare, and if the market as a whole has fallen by 20%, then it is most likely that we are already close to the end of the tunnel and that it will then begin to recover. Selling in that situation could be a mistake that costs you dearly.
Secondly, another common mistake is to buy the most stable or highest quality stocks, which are generally the ones that have fallen the least with this general decline. Why is this a mistake? Basically, these are the stocks that will have the smallest gains when the market recovers, which is why you will not be maximizing your upside potential if you overweight these stocks. If I think about it, this wouldn't be a “mistake” per se, but rather a more conservative strategy.
Thirdly, another common mistake when reacting to widespread market declines is buying the "past darlings" or the stocks that had been the stars of the previous cycle. Seeing that those same stocks are now 70% or 80% cheaper, one could assume that it is a good opportunity; however, that does not mean that they will return to previous levels in the new cycle. You can take a look at the chart of companies like Zoom, Peloton, or Carvana to understand that past euphoria is not necessarily going to transform into future euphoria. One should be analyzing the business model and not thinking in those terms anyways.
Finally, one of the most serious mistakes one could make when the market falls is to establish a "short" position to benefit from future falls. Predicting market behaviour is one of the most difficult things to do, and you probably won't have good results if you follow these types of strategies.
Historical Market Metrics to Knowing What to Expect
Certainly, past performance does not imply future performance, but it is always good to have an understanding of what the market has done in the past.
Having a frame of reference to assign probabilities is one of the most valuable skills you can develop as an investor.
Is a 20% drop in one month for the S&P 500 normal? Is a 50% drop something that happens once in a lifetime? What has happened in the past?
These are questions to which I have to know the answers, not only to have a parameter of what is possible but also to be able to be psychologically calmer and make better decisions.
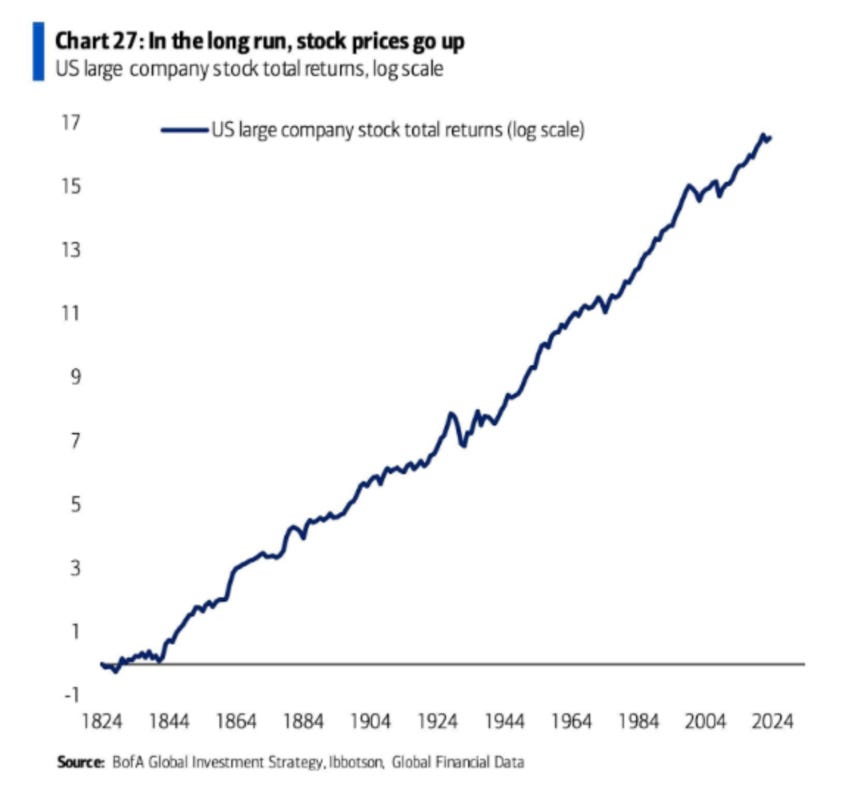
So what should you expect from the overall market? Historically, the stock market has always tended to rise (I always refer to the United States stock market, which is the largest stock market in the world).
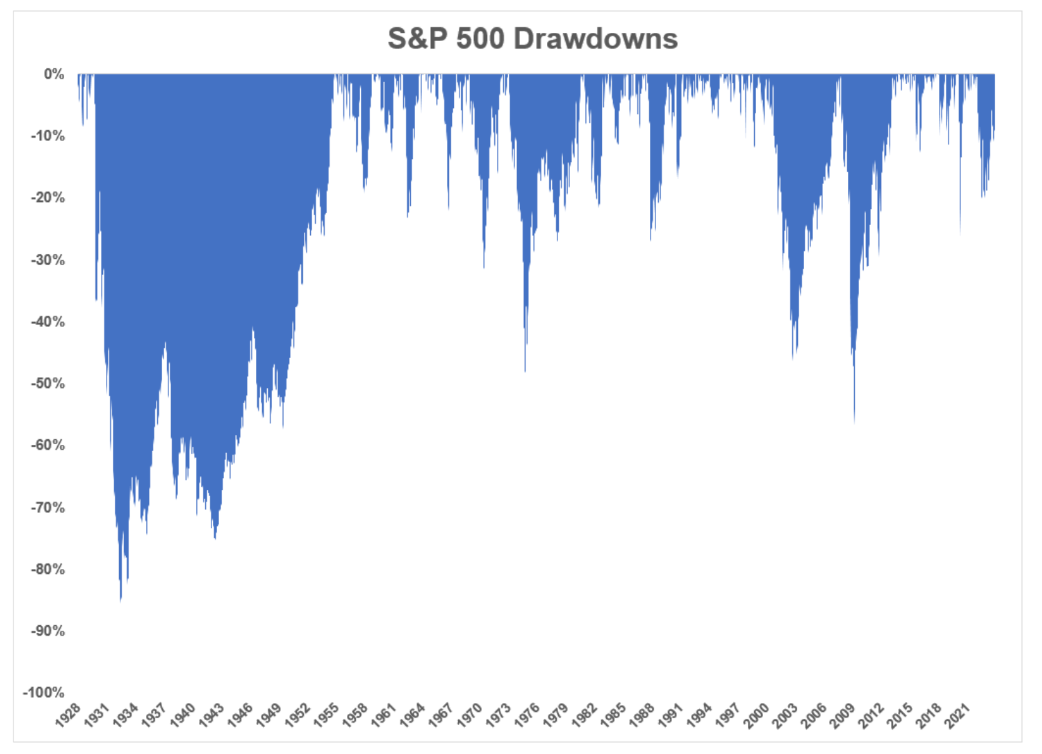
In the chart above, we have 200 years of history, and clearly, it has always been going up. Now, in the short term, anything can happen, and the market can fall sharply in a period of months. What are those falls like? To understand them better, we should look at a chart of "drawdowns."
There we can see that, indeed, the Great Depression of the 1930s was an event that had consequences for several years and that the crisis of 2008 was also a crisis of large proportions.
It is useful to remember the psychology of the market at such times. Here it is simply seen as some lines on a graph; however, in the moment it is a rollercoaster of emotions, and maintaining a calm approach can become a really difficult task.
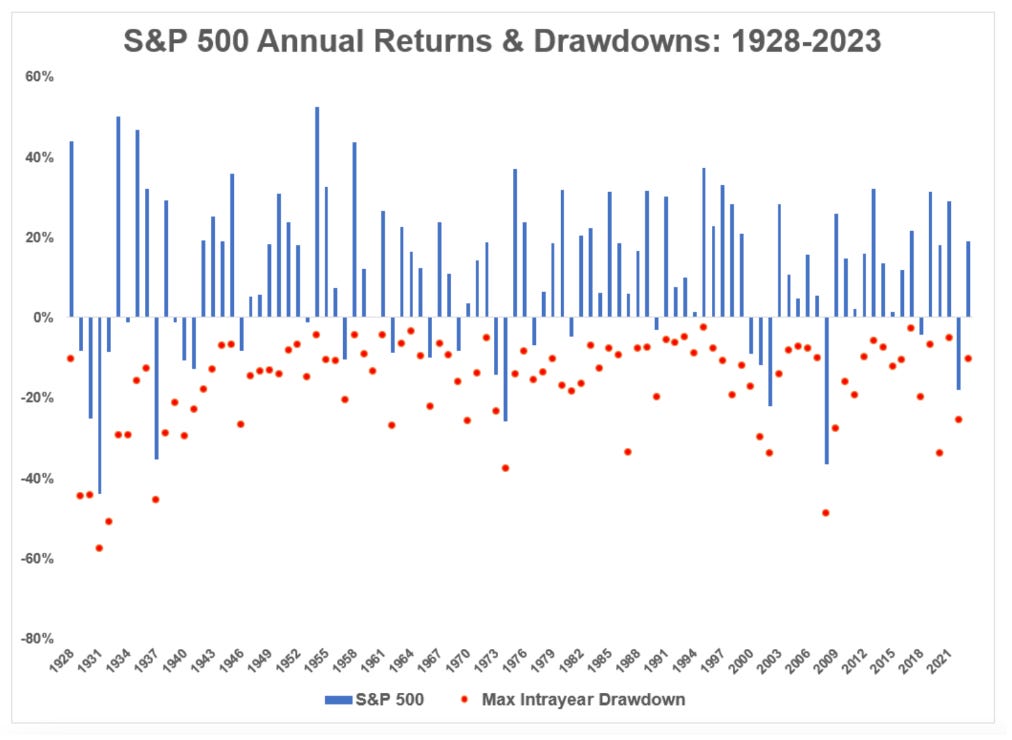
Another nuance to keep in mind when analyzing the drawdown graph is that these are the drop percentages at the close of the year, but that during the year itself, the drops can be even greater.
In the graph below, you can see that during the 2008 crisis, the drop during the year was much greater than the closing number.
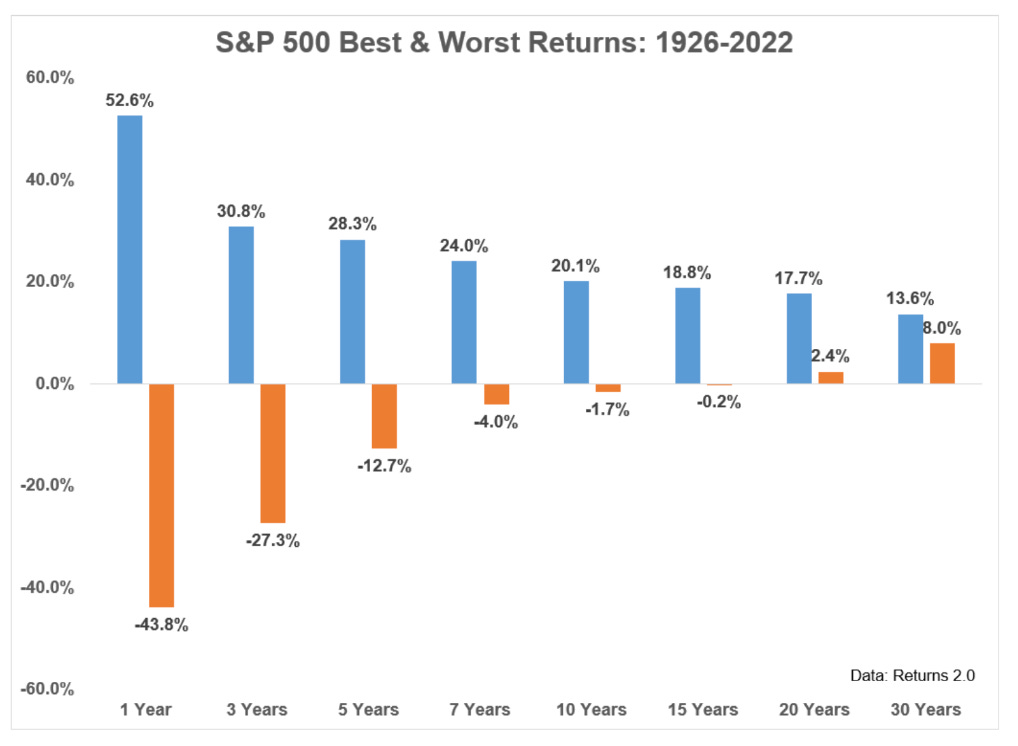
Finally, it should be noted that the long term must always be taken into account, and that during the last 95 years of history in the United States stock market, no 20-year period has generated losses. Now, for periods of 1 year, the result is almost like flipping a coin.
If we analyze the historical performance of the United States stock market, we see that:
Drops of up to 10% are relatively common and we should expect them at least once a year.
Falls of up to 20% are a little rarer and we should expect them every 3 or 5 years; generally, these bearish periods do not last more than one or two years.
Drops of 30% occur very sporadically and we should expect them only once every 10 years on average.
Finally, falls of around 40% are extremely rare events and should not occur more than once in periods of 30 years.
Reacting to Decline in a Specific Stock
The first step in knowing how to react to specific drops in a stock's price is to determine whether that drop is temporary or permanent. To determine this, one must analyze the business model and whether it has been affected by the situation that is occurring. I’ll write about this topic extensively on a coming article.
Basically, if the conclusion of the analysis is that the company's business model, that is, its ability to generate profits, has been permanently affected, then one should sell the position.
On the other hand, if the result of the analysis is that it has been a temporary situation and that the ability to generate future profits of the company has not been affected, then one could even consider increasing your position in the company.
An Investor’s Checklist
In this checklist, I share a way of approaching these market situations so that you can go through them without major problems and get the most out of your returns as an investor.
Determining the Cause of the Fall
General Market Review
Main market indices: Check how the main market indices (such as the S&P 500, Dow Jones, NASDAQ) are performing. This will give you a general idea of the market trend.
Economic and political news: Consider recent economic news and political events that could be influencing global financial markets.
Global Economic Context
Interest rates and monetary policy: Changes in interest rates and monetary policy can have a large impact on stock markets.
Global economic indicators: Data such as GDP, inflation, and global employment can offer clues about the overall health of the economy and its effect on markets.
Sectorial Analysis
Sector performance: Compare the performance of the stocks in your portfolio with that of their respective sector. This can indicate if the decline is specific to your portfolio or is a sector trend.
Sector news and events: Investigate whether there are recent events or sector-specific news that may be affecting the value of the stock.
Review of Individual Stocks
Fundamental analysis of each stock: Check out the fundamentals of each company (such as revenue, earnings, debt, etc.). Drops in these indicators can signal specific problems for the company.
Company news: Look for recent news about the companies in your portfolio. Changes in management, scandals, or new products can influence the stock price.
Technical and Market Indicators
Trading volumes: An increase in trading volume may indicate increasing or decreasing interest in certain stocks or sectors. A fall without volume can be easily reversible.
Historical price movements: Compare current price movements with historical patterns to understand if the decline is part of a broader trend.
Reacting to a General Market Decline
Rebalancing and Strategic Adjustments
Consider rebalancing your portfolio: If the market decline has unbalanced your asset allocation strategy, consider rebalancing.
Evaluate buying opportunities: A general market decline can present buying opportunities at attractive prices.
Preparation for Recovery
Plan for the future: Think about how the actions you take now can affect your portfolio when the market begins to recover.
Flexibility and adaptability: Be prepared to adjust your strategy depending on how market conditions evolve.
Reacting to an Individual Stock Decline
Action-Specific Research
Analyze company fundamentals: Review financial reports, earnings, debt, and other fundamental indicators to understand if there are underlying problems.
Search recent news about the company: Inform yourself about management changes, corporate announcements, earnings results, or scandals that may influence the stock price.
Reevaluate your investment thesis: Think about whether the reasons you bought the stock are still valid.
Strategic Reaction
Consider buying more: If you think the decline is temporary and the company is still strong, it could be an opportunity to buy more at a lower price.
Sell or hold the position: Decide if it is better to sell the stock to cut losses or hold it with the expectation of a recovery.
Conclusion
Being prepared for bear markets is an important part of the work in investing. The first part of the job is to do the correct research and analysis of the company to be able to buy well. The second part of the job is to monitor the company and be prepared for any eventuality that, as we saw, may come from a sharp drop in the market or from changes in the fundamental components of the business.
By mastering the concepts in this article, you can be prepared not only to face these types of situations with peace of mind but also to understand when a decline is part of the natural behaviour of the market.
Sources
Carlson, B. (2023, November 17). 4 Charts That Explain the Stock Market. A Wealth of Common Sense. Retrieved from https://awealthofcommonsense.com/2023/11/4-charts-that-explain-the-stock-market/
Shearn, M. (2011). The Investment Checklist: The Art of In-Depth Research. Hoboken, NJ: John Wiley & Sons, Inc.
Estebaranz, A. (2023). The Art of Investing. Deusto: Barcelona, Spain.


